
 Whatsapp
Backward-Bending Labour Supply Curve: Why Higher Wages Can Mean Fewer Hours
Learn why a worker may choose fewer hours at a higher wage, how income and substitution effects compete, and how to draw the curve correctly.
- 12th
- Economics

Imagine a tutor who earns Rs 500 for an extra hour of teaching. If the payment rises to Rs 700, will she always take more classes?
Perhaps. But she might decide that she can now meet her income goal with fewer classes and spend an evening with her family. The second decision is the idea behind the backward-bending supply curve of labour.
At first, higher wages encourage a person to work more. Beyond a point, an even higher wage may encourage that same person to work less. The surprising part is easier to understand when we remember what a worker is choosing between: paid work and free time.
First, What Does the Usual Law of Supply Say?
The law of supply describes a direct relationship between price and quantity supplied, when other relevant conditions stay the same. A higher selling price usually encourages a producer to offer more of a good. You can revisit that starting point in our guide to supply and supply curves.
Labour has a price too: the wage per hour. An individual supplies labour by offering hours of work. So an ordinary upward-sloping labour supply curve says that a higher wage encourages more hours of work.
But a person cannot treat time like an unlimited stock of goods. Every extra hour worked is an hour unavailable for rest, family, study, or anything else the person values. That is why the response to a wage rise can change.
The Choice Behind the Curve
Suppose a worker has 10 hours in a day that can be divided between paid work and free time. Sleep and other fixed commitments are already left out of those 10 hours.
If the worker chooses 6 hours of work, there are 4 hours of free time. If the worker chooses 7 hours of work, there are 3 hours of free time.
The wage changes the value of that choice. At Rs 300 an hour, giving up one free hour brings Rs 300. At Rs 600 an hour, giving up one free hour brings Rs 600. Free time has become more costly in terms of earnings given up.
At the same time, the higher wage lets the worker earn a target amount in fewer hours. Both thoughts can be true at once. The actual choice depends on which one matters more to the worker.
A Simple Schedule That Bends Backward
Here is an illustrative schedule for one worker. The numbers show possible choices, not a rule that every worker follows.
| Hourly wage | Work hours per day | Free hours from the 10 available | Daily earnings |
|---|---|---|---|
| Rs 300 | 6 | 4 | Rs 1,800 |
| Rs 400 | 7 | 3 | Rs 2,800 |
| Rs 500 | 7 | 3 | Rs 3,500 |
| Rs 600 | 6 | 4 | Rs 3,600 |
Read the first two rows together. When the wage rises from Rs 300 to Rs 400, the person increases work from 6 to 7 hours. This is the familiar upward-sloping part.
Now read the last two rows. When the wage rises from Rs 500 to Rs 600, the person reduces work from 7 to 6 hours. That is the backward-bending part. The worker gets an extra hour of free time and earns Rs 100 more in this example.
The middle rows also show a possible pause: the wage rises from Rs 400 to Rs 500 while hours stay at 7. On a graph, this looks nearly vertical.
Do not assume that daily earnings must rise whenever the wage rises. Earnings depend on wage multiplied by hours. If hours fall sharply, total earnings may fall despite a higher hourly wage. Always calculate before making a claim about income.
How to Read and Draw the Diagram
Put hours of labour supplied on the horizontal axis and the wage rate on the vertical axis. Plot each wage and hours pair from the schedule. Join the points with a smooth curve.
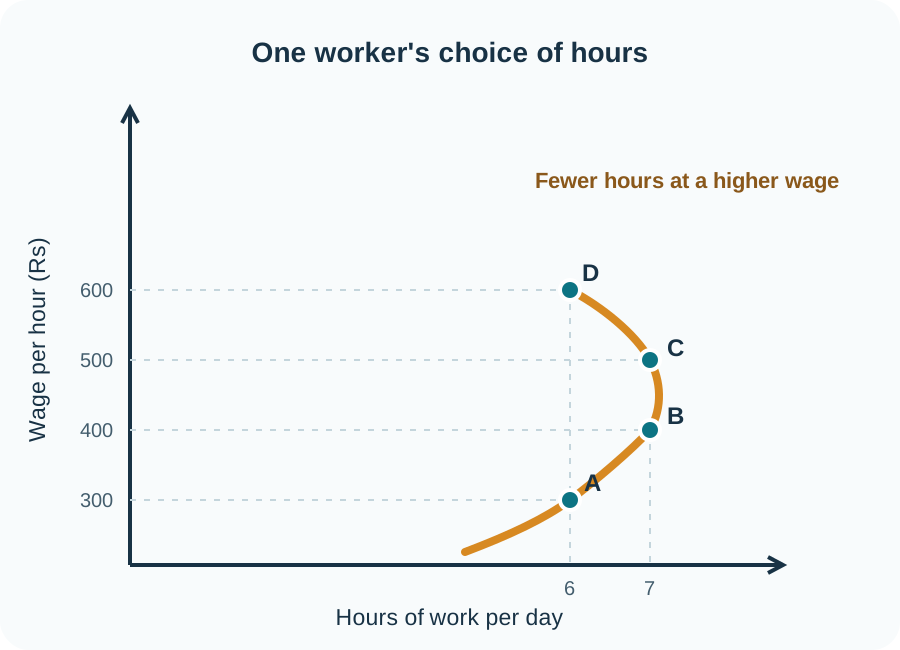
Move from A to B: the wage rises and hours move right from 6 to 7. Move from B to C: the wage rises while hours remain at 7. Move from C to D: the wage rises again, but hours move left from 7 to 6.
That last move is the key. The curve bends backward because the horizontal coordinate decreases while the vertical coordinate increases.
The bend is not a fixed wage such as Rs 500 for everyone. It depends on the person’s preferences, circumstances, and ability to choose working hours.
The Two Forces Behind a Wage Rise
Economists give names to the two pulls a worker feels when the wage rises. The names can sound formal, but the ideas are familiar.
1. Substitution effect: work becomes more attractive
When the hourly wage increases, an hour of free time means giving up more potential pay than before. The worker may choose to replace some free time with paid work.
This pull leads to more hours of work and less free time. It explains the usual upward-sloping portion of an individual’s labour supply curve.
Think of a student who tutors for a few hours each week. If the fee for an extra session rises, taking that session may look worthwhile.
2. Income effect: free time becomes easier to afford
At a higher wage, the worker can earn more even without increasing hours. If the worker values free time and can afford to take it, they may choose to work fewer hours.
This pull leads to more free time and fewer hours of work. It is especially easy to imagine when the worker already earns enough to cover important needs, though income alone does not guarantee this response.
The tutor might say, “I can meet this month’s goal with six sessions instead of seven. I would rather keep Friday evening free.”
Which force wins?
| Stronger response to a higher wage | Work hours | Shape on the diagram |
|---|---|---|
| Substitution effect | Increase | Curve slopes upward |
| Effects roughly balance | Stay about the same | Curve is close to vertical |
| Income effect | Decrease | Curve bends backward |
The same wage rise can lead different people to make different choices. A worker paying urgent bills may take every extra hour available. Another worker with secure earnings and flexible hours may protect more free time.
Why This Is a Special Case of Supply
The usual law of supply helps us predict how a producer responds to a better price for a product. The backward-bending curve deals with an individual’s choice of work hours as wages change.
Once the income effect is stronger, a higher wage no longer leads to more hours from that individual. In that range, the ordinary direct relationship between wage and hours supplied does not hold.
There is no need to say that the law of supply is useless or that workers always work less when pay improves. The more accurate statement is narrower: an individual’s labour supply may bend backward beyond a certain wage range.
The familiar rising portion can still exist at lower wages. Indeed, the backward bend makes sense only when we understand both portions of the same curve.
One Worker Is Different From a Whole Labour Market
Suppose one experienced tutor reduces her weekly hours after a raise. Does that prove the total supply of tutors in the city will fall if tutoring wages rise? No.
Higher wages may attract new tutors or encourage other existing tutors to take more classes. Total market hours can increase even while one person’s hours decrease. The individual curve and the market curve answer different questions.
| Question | What is counted? | Can it bend backward? |
|---|---|---|
| One person’s labour supply | That person’s chosen work hours | Yes, it may |
| Supply of labour in a market | Hours offered by all relevant workers | It can differ from the individual pattern; often slopes upward |
This is also why a company’s decision to hire workers is a separate topic. Employers demand labour; workers supply it. The backward-bending curve describes the worker’s side of the choice.
A Movement, a Shift, or a Different Decision?
The backward bend is drawn by changing the wage rate and observing how the same worker’s chosen hours respond, while other conditions are treated as unchanged. We move between points on that person’s supply curve.
If something else changes, such as childcare, health, a new income source, or the freedom to choose hours, the person’s entire pattern of choices may change. A new curve may be needed.
In real life, the worker may also face a fixed shift set by an employer. A rise in hourly pay then might change earnings without changing hours at all. The diagram describes a choice where adjusting hours is possible. It is a way to reason about behaviour, not a promise that every workplace offers flexible schedules.
How to Write a Clear Answer in an Exam
For a short answer, use this sequence:
- Define it as the part of an individual labour supply curve where a higher wage leads to fewer hours supplied.
- State the two opposing effects of a wage rise.
- Explain that the income effect is stronger than the substitution effect on the backward-bending portion.
- If a diagram is requested, label wage on the vertical axis and hours of labour on the horizontal axis, then show the upper curve turning left.
A complete answer could read:
If there is room, add that this need not describe the market supply curve. That one sentence prevents a common overgeneralisation.
Mistakes That Can Cost You Clarity
Drawing the bend to the right. If the wage rises while hours fall, the curve must move left as it goes up. A curve that keeps moving right still shows more hours.
Calling it a demand curve. Workers supply their time. Employers demand work hours. Keep the two sides separate.
Saying leisure becomes cheaper when wages rise. It becomes more expensive in terms of forgone earnings. That is why the substitution effect favours work. The income effect works in the other direction.
Assuming the income effect always dominates. It may dominate over a particular range for a particular person. Other workers may increase hours or keep them unchanged.
Claiming a higher wage always means higher total earnings. Multiply the wage by the hours in each case before concluding anything about earnings.
Confusing hours with workers. One person may work fewer hours while a higher wage attracts more people into the market.
Try These Quick Checks
1. A worker raises weekly hours from 30 to 35 when the hourly wage rises. Which effect is stronger in this range?
The substitution effect is stronger, because the worker chooses more paid hours.
2. A worker keeps weekly hours at 35 after a wage rise. Does this show a backward bend?
No. Hours have not fallen. This is the nearly vertical case in which the two pulls roughly balance or hours are fixed.
3. A worker reduces hours from 35 to 30 after a wage rise, with the choice of hours available. What does the upper part of the individual supply curve do?
It bends left as the wage rises. The income effect is stronger in that range.
4. Wages rise from Rs 400 to Rs 500. Hours fall from 8 to 7. Did daily earnings rise?
Yes. Earnings change from Rs 3,200 to Rs 3,500. The reduction in hours is smaller than the proportional increase in the wage.
5. Does one worker cutting hours prove that market labour supply has fallen?
No. Other workers may increase hours, and new workers may enter the market.
Read More if You Are Curious
For a fuller explanation of the work and free-time choice, see OpenStax on income and substitution effects. Its labour and free-time lesson shows why a worker might increase, keep, or reduce hours after a wage rise. Boston University’s open labour markets chapter explains why the market curve can differ from an individual’s curve.
Frequently Asked Questions
What is a backward-bending supply curve of labour?
It is the part of an individual’s labour supply curve where a higher wage is associated with fewer hours of work. On the standard diagram, the curve turns left as it rises.
Why does the labour supply curve bend backward?
The higher wage makes free time more affordable. When this income effect is stronger than the substitution effect that encourages more work, the person chooses fewer hours.
Is the backward bend seen at every wage?
No. At lower wages, a person may work more when pay rises. The bend is a possible response over a later wage range, not a universal rule.
Which axis shows wages?
Put the wage rate on the vertical axis. Put hours of labour supplied on the horizontal axis.
What does the substitution effect do after a wage rise?
It encourages more work because an hour of free time now means giving up more possible earnings.
What does the income effect do after a wage rise?
If free time is something the person wants more of as they become better off, it encourages fewer work hours and more free time.
Can a worker earn more while working fewer hours?
Yes. A sufficiently large increase in the hourly wage can more than offset a small reduction in hours. Calculate wage multiplied by hours to check a particular case.
Is the backward-bending curve for one worker or the entire market?
The familiar backward-bending example describes an individual worker. Total market supply may still rise when higher wages attract additional workers.
Does a wage increase always let workers cut their hours?
No. Some jobs have fixed shifts, and some workers need or prefer to work more. A person’s ability to choose hours matters.
What is the shortest correct exam explanation?
At higher wages, an individual may choose more free time and fewer work hours. When the income effect exceeds the substitution effect, that individual’s labour supply curve bends backward.
Looking for commerce tuitions?
Prachi is a gold-medalist commerce teacher with experience at Deloitte and KPMG. She focuses on fundamentals to build a strong foundation.