
 Whatsapp
Production Possibility Curve: Shift vs Rotation Explained
Learn PPC shifts, rotations and movements with clear graphs, technology examples, opportunity-cost calculations and practice questions with answers.
- 11th
- Economics

Imagine a small economy that grows wheat and weaves cloth. One morning, its workshops start making more cloth. Has its production possibility curve shifted?
We cannot tell yet. Perhaps workers have moved from farming to weaving. Perhaps idle looms have restarted. Or perhaps a new loom produces twice as much cloth with the same inputs.
All three stories can raise cloth output. They do not describe the same change on a graph.
A production possibility curve (PPC) shows the maximum feasible combinations of two goods with given resources and technology, when resources are used fully and efficiently. It is also called the production possibility frontier (PPF). The distinction between the production boundary and the points inside it follows the NCERT introduction to microeconomics.
The quickest way to distinguish a shift from a rotation is to check the two axis intercepts. But first, check whether the boundary needs to move at all.
The four pictures you need to recognise
Throughout this guide, cloth is on the horizontal axis and wheat is on the vertical axis. All quantities are imaginary classroom examples measured per year.
| What changes? | How to show it | Example |
|---|---|---|
| Allocation of fully employed resources | Movement along the same PPC | Farm workers move into weaving |
| Use of existing idle resources | Movement from inside towards the same PPC | Idle looms resume production |
| Maximum output of both goods | Outward or inward shift affecting both intercepts | Productive resources usable in both sectors increase or decrease |
| Maximum output of one good, with the other intercept unchanged | Rotation, or pivot, of the PPC | Better looms improve only cloth production |
A rotation is a particular kind of change in the frontier. Some books call it a biased shift. When a question distinguishes “shift” from “rotation”, explain what happens to each intercept rather than arguing over the word alone.
Read the intercepts before reading the curve
Suppose the economy can produce at most 60 units of cloth if it produces no wheat. It can produce at most 120 units of wheat if it produces no cloth.
Its intercepts are:
- Horizontal intercept: (60, 0). All available resources are allocated to cloth production.
- Vertical intercept: (0, 120). All available resources are allocated to wheat production.
An intercept is a maximum under an extreme allocation. It is not a prediction that the economy will actually choose to produce just one good.
Now compare three changes:
| Case | Maximum cloth | Maximum wheat | What the endpoints tell us |
|---|---|---|---|
| Original capacity | 60 | 120 | Starting frontier |
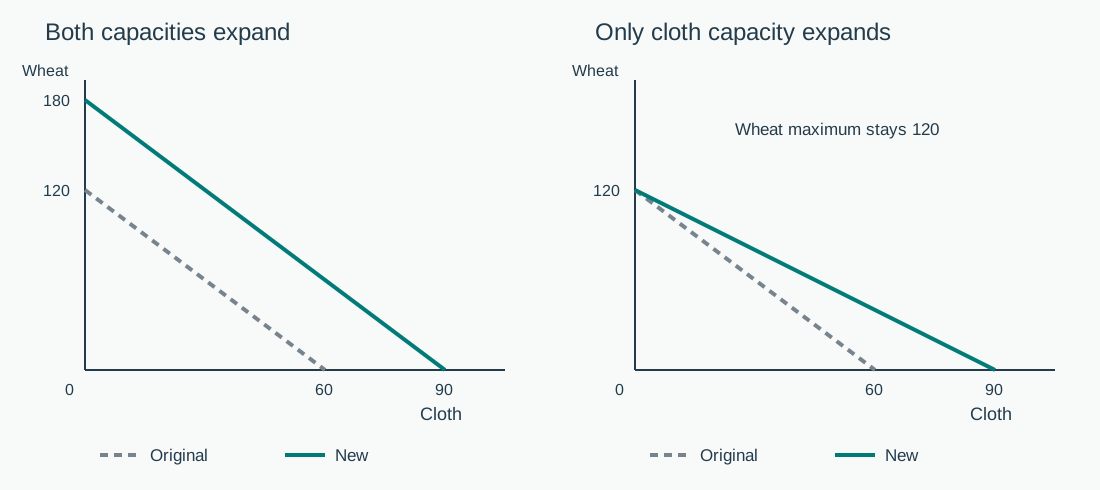
| Both capacities expand | 90 | 180 | Both endpoints move away from the origin |
| Cloth technology improves alone | 90 | 120 | Cloth endpoint moves; wheat endpoint stays fixed |
| Wheat technology improves alone | 60 | 180 | Wheat endpoint moves; cloth endpoint stays fixed |
These endpoint checks are simple enough to do in the margin of an exam answer. They also prevent the most common drawing error: moving the intercept of the unaffected good.
Movement along the PPC: a different production choice
For our first numerical example, assume a straight-line frontier:
Wheat = 120 - 2 × Cloth
This example deliberately assumes constant opportunity cost. We will use a bowed curve later.
At A, the economy produces 20 cloth and 80 wheat. At B, it produces 30 cloth and 60 wheat.
Check both combinations:
- At A: 120 - 2 × 20 = 80 wheat.
- At B: 120 - 2 × 30 = 60 wheat.
The economy gains 10 cloth and sacrifices 20 wheat. Its resources and technology are unchanged. It has simply chosen another point on the same frontier.
Opportunity cost of each extra cloth unit = 20 ÷ 10 = 2 wheat units.
A question might say consumers now prefer cloth, so resources are reallocated to weaving. That change in preferences can help explain the choice of B, but it does not, by itself, enlarge the set of feasible combinations.
Movement towards the PPC: using what was already available
Keep the same frontier. Consider point U, where the economy produces 20 cloth and 40 wheat.
At 20 cloth, its frontier permits 80 wheat. U therefore lies inside the production boundary.
If unemployed farm workers return to existing jobs and wheat output rises to 80, the economy moves from U to A. No new frontier is needed. The additional 40 wheat comes from better use of capacity that already existed.
It could also move from U to B, increasing cloth from 20 to 30 and wheat from 40 to 60. Both actual outputs can increase without an outward shift when the starting point is inside the PPC.
This is why “production has increased” is not enough information to classify a diagram. The Federal Reserve’s lesson on underemployment and economic growth separates a recovery towards existing capacity from an expansion of that capacity.
The reverse distinction matters too. If orders fall and factories stand idle, the production point can move inward while the PPC stays where it is. If machinery is physically destroyed, productive capacity itself may shrink.
Outward shift: both production limits expand
Suppose the economy receives additional productive resources that can be used in either sector. For illustration, let the new frontier be:
Wheat = 180 - 2 × Cloth
Maximum wheat rises from 120 to 180. Maximum cloth rises from 60 to 90. Both intercepts move outward.
At 30 cloth:
- Old maximum wheat: 120 - 60 = 60.
- New maximum wheat: 180 - 60 = 120.
The combination (30 cloth, 120 wheat) was outside the old frontier but lies on the new one. That is a capacity gain, not merely the reopening of an idle workshop.
Possible causes include usable additions to labour and capital, or technological improvements that raise production possibilities in both sectors. The question should tell you enough to establish the effect. More money printed, for example, is not automatically more productive machinery, land or skills.
The new frontier permits higher production. It does not force the economy to reach it immediately. Actual production may remain inside the enlarged boundary.
Rotation towards the cloth axis: one intercept stays fixed
Now return to the original economy and change only the cloth technology. Assume improved looms raise maximum cloth from 60 to 90, while maximum wheat remains 120.
Our new illustrative frontier is:
Wheat = 120 - (4/3) × Cloth
Check the endpoints:
- If cloth is zero, wheat is still 120.
- If wheat is zero, cloth is 90.
The frontier pivots outward about the unchanged wheat intercept. The horizontal endpoint moves to the right. For this straight-line diagram, the line becomes flatter.
A subtle point: wheat output can rise too
“Only cloth technology improves” does not mean that actual wheat output must remain unchanged.
At 30 cloth, the old frontier permits 60 wheat. The new frontier permits:
120 - (4/3 × 30) = 80 wheat.
Cloth is now produced with fewer resources. Resources released from weaving can be used to grow wheat. So the economy can keep cloth output at 30 and raise wheat output from 60 to 80.
What stays unchanged is maximum wheat when no cloth is produced. At that intercept, the economy is not using cloth technology anyway.
This assumes the usual two-good model with resources that can be reallocated. If a question specifies resources that cannot move between sectors, use those restrictions rather than forcing this simple example onto it.
What happens to opportunity cost?
On the original straight line, one extra cloth costs 2 wheat. On the new line, it costs 4/3 wheat.
For example, moving from 30 to 45 cloth on the new frontier reduces wheat from 80 to 60:
Wheat sacrificed per cloth = 20 ÷ 15 = 4/3.
The cloth-specific improvement lowers the opportunity cost of cloth in this example. Conversely, one wheat costs 3/4 cloth on the new line, compared with 1/2 cloth before. Always state which good’s cost you are measuring.
Rotation towards the wheat axis
Suppose instead that an improved wheat-growing method raises maximum wheat from 120 to 180, while maximum cloth stays 60.
Use this frontier:
Wheat = 180 - 3 × Cloth
The vertical intercept rises to 180. The horizontal intercept stays at 60. The frontier pivots outward about the cloth intercept and becomes steeper in this straight-line example.
At 20 cloth, wheat rises from 80 on the original frontier to 120 on the new one.
Notice the opportunity-cost result. One extra cloth now sacrifices 3 wheat rather than 2. That does not mean cloth production became technically worse. Wheat production became more productive, making the wheat forgone more valuable in physical output terms.
Inward shifts and inward rotations
A fall in productive capacity reverses the outward cases.
If damage reduces maximum cloth from 60 to 40 and maximum wheat from 120 to 80, both intercepts move inward. A possible new straight-line frontier is:
Wheat = 80 - 2 × Cloth
At 20 cloth, only 40 wheat is now feasible on the frontier, compared with 80 previously.
If the damage affects only cloth capacity, a classroom question may instead specify maximum cloth of 40 and unchanged maximum wheat of 120. Then the cloth endpoint moves inward while the wheat endpoint stays fixed.
Do not classify every drought, flood or equipment failure by a memorised label. Read what the event does to the model’s resources and productive limits. A flood might destroy resources in both sectors; a narrowly specified crop disease might affect only the agricultural side.
The University of Victoria discussion of frontier changes provides useful background on technology, training and resource losses. For an answer about a particular event, add the assumption that connects that event to the endpoints you draw.
Why the usual PPC is bowed out
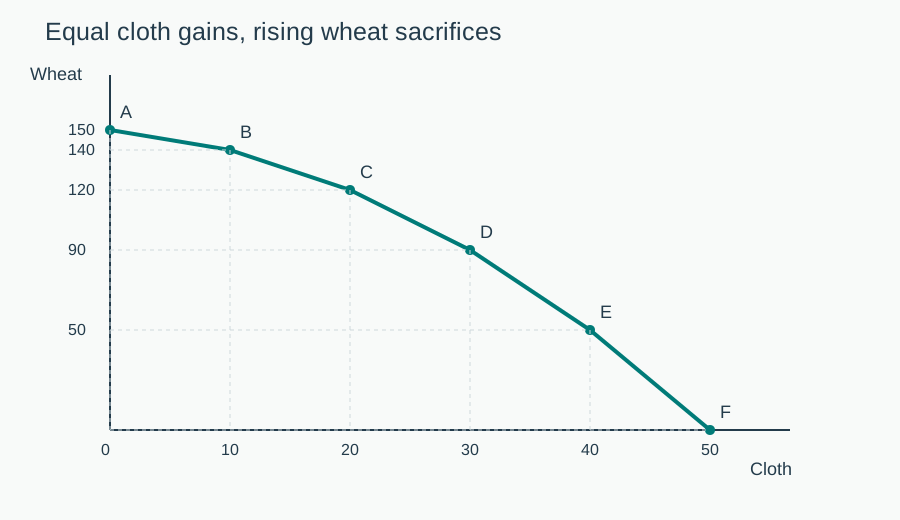
Our straight lines made rotations and calculations easy to see. Many textbook PPCs are instead concave to the origin, also described as bowed outward. Their slope becomes steeper as we move rightwards.
The reason is increasing marginal opportunity cost: resources are not equally suitable for both goods. As cloth production expands, the economy eventually transfers resources that were especially useful in wheat production.
OpenStax explains this link between resource suitability and increasing opportunity cost.
Here is a separate, invented production schedule:
| Combination | Cloth units | Wheat units | Wheat sacrificed for the next 10 cloth |
|---|---|---|---|
| A | 0 | 150 | 10 |
| B | 10 | 140 | 20 |
| C | 20 | 120 | 30 |
| D | 30 | 90 | 40 |
| E | 40 | 50 | 50 |
| F | 50 | 0 | No further combination shown |
The sacrifice per extra cloth across successive intervals is 1, 2, 3, 4 and 5 wheat units.
For B to C, it is (140 - 120) ÷ (20 - 10) = 2 wheat per cloth. For D to E, it is (90 - 50) ÷ (40 - 30) = 4 wheat per cloth.
These are rates over the listed intervals. On a smooth curve, the exact marginal rate at one point is the magnitude of the tangent’s slope.
Total cost is not the same as cost per unit
Moving from B to E increases cloth from 10 to 40 and reduces wheat from 140 to 50.
- Total opportunity cost: 90 wheat units.
- Average sacrifice per additional cloth over B to E: 90 ÷ 30 = 3 wheat units.
- Sacrifice per cloth in the final listed interval, D to E: 4 wheat units.
All three answers can be correct for different questions. Read whether the question asks for a total, an average or the cost of the next increment.
A reliable way to write a diagram answer
Try this sequence when a question describes a new machine, unemployment, population change or disaster.
- State the initial assumption. Are resources fully and efficiently employed, or is the economy inside its PPC?
- Identify the cause. Has allocation, utilisation, resource availability or technology changed?
- Check each intercept. Could the economy produce more cloth if it produced no wheat? Could it produce more wheat if it produced no cloth?
- Draw and label. Name both goods, the original frontier and any new frontier. Add a direction arrow or a clearly explained point movement.
- Explain the result in a sentence. Connect the cause to capacity and then to the diagram.
For example:
For a question about investment, separate today from tomorrow. Producing more capital goods today can involve movement along today’s PPC and a sacrifice of current consumer goods. Once productive capital is available for use, it can expand future capacity. Buying an existing machine from another domestic owner does not, by that transaction alone, add a machine to the economy.
If the underlying idea of forgone alternatives still feels unfamiliar, revisit our guide to scarcity, choice and opportunity cost.
Practice: decide before checking the answers
1. Idle workers return to existing factories. Resources and technology are unchanged. What happens to the PPC?
2. Maximum cloth rises from 60 to 90, while maximum wheat stays 120. Which endpoint moves?
3. Maximum wheat rises from 120 to 180, while maximum cloth stays 60. About which endpoint does the frontier pivot?
4. On Wheat = 120 - 2 × Cloth, output changes from (10 cloth, 100 wheat) to (25 cloth, 70 wheat). Find the total opportunity cost and the cost per extra cloth.
5. A point has 20 cloth and 100 wheat. Is it feasible under Wheat = 120 - 2 × Cloth? Is it feasible under Wheat = 180 - 2 × Cloth?
6. In the bowed schedule, find the opportunity cost per cloth from C to D.
7. Demand falls, so usable factories stop production. Must the PPC shift inward?
8. Better cloth technology permits wheat output to rise at unchanged cloth output. Does that contradict a cloth-only outward rotation?
Answers with reasons
1. The economy moves towards its existing PPC. The productive boundary does not change merely because idle resources resume work.
2. The cloth endpoint moves from (60, 0) to (90, 0). The wheat endpoint remains (0, 120).
3. It pivots about the unchanged cloth endpoint, (60, 0). The wheat endpoint moves upward.
4. Cloth increases by 15 and wheat falls by 30. Total opportunity cost is 30 wheat; cost per extra cloth is 30 ÷ 15 = 2 wheat.
5. Originally, 20 cloth permits at most 80 wheat, so the point is outside. Under the new frontier it permits 140 wheat, so (20, 100) is feasible and lies inside.
6. Wheat falls from 120 to 90 while cloth rises from 20 to 30. The rate is 30 ÷ 10 = 3 wheat per cloth.
7. No. With productive resources intact, the production point can move inside the unchanged frontier. Capacity loss would require additional information.
8. No. More efficient weaving can release resources for wheat. The unchanged feature is maximum wheat at zero cloth, not wheat output at every mixed combination.
Frequently asked questions
1. What is the difference between a PPC shift and a PPC rotation?
In the usual classroom distinction, a general shift moves both axis intercepts. A rotation leaves one intercept fixed while the other changes. More broadly, a rotation can be described as a biased shift of the frontier.
2. Does every technological improvement shift both endpoints outward?
No. An improvement confined to one good can raise its maximum output while leaving the other maximum unchanged. Improvements affecting both sectors can move both endpoints outward.
3. Does removing unemployment shift the PPC?
Not when it means employing existing idle resources with unchanged technology and capacity. That moves production towards the existing frontier. A programme that also builds skills or adds productive equipment can have a separate capacity effect.
4. Can both goods increase without shifting the curve?
Yes, if the economy starts inside the frontier and uses idle resources better. At a productively efficient point on the same downward-sloping frontier, more of one good requires less of the other.
5. Is an outward PPC shift always parallel?
No. The gains may differ across sectors, changing the frontier’s shape and slopes. A parallel shift is a special illustrative case.
6. Why does the PPC slope downward?
With resources fully and efficiently employed, increasing one output requires diverting resources from the other. That sacrifice creates the downward slope in the standard two-good model.
7. Why is a PPC usually concave to the origin?
The usual assumption is increasing opportunity cost because resources have different suitability for different uses. The frontier becomes steeper as production of the horizontal-axis good increases. Constant opportunity cost gives a straight line instead.
8. How do I calculate the marginal rate of transformation?
For a table interval, divide units of the vertical-axis good sacrificed by additional units of the horizontal-axis good obtained. Report the positive sacrifice ratio and its units. On a smooth PPC, the corresponding point measure is the absolute slope of the tangent.
9. Is a point outside the PPC impossible forever?
No. It is beyond current domestic production capacity under the stated assumptions. Resources or technology may improve later. Also distinguish production from consumption: trade can permit consumption combinations beyond a country’s domestic production frontier without automatically expanding that frontier.
10. What should I check first in a shift-or-rotation question?
Ask whether capacity changed at all. If it did, check the maximum output of each good separately. Two changing intercepts suggest a general shift; one fixed intercept and one changing intercept indicate a rotation in the standard diagram.
Looking for commerce tuitions?
Prachi is a gold-medalist commerce teacher with experience at Deloitte and KPMG. She focuses on fundamentals to build a strong foundation.